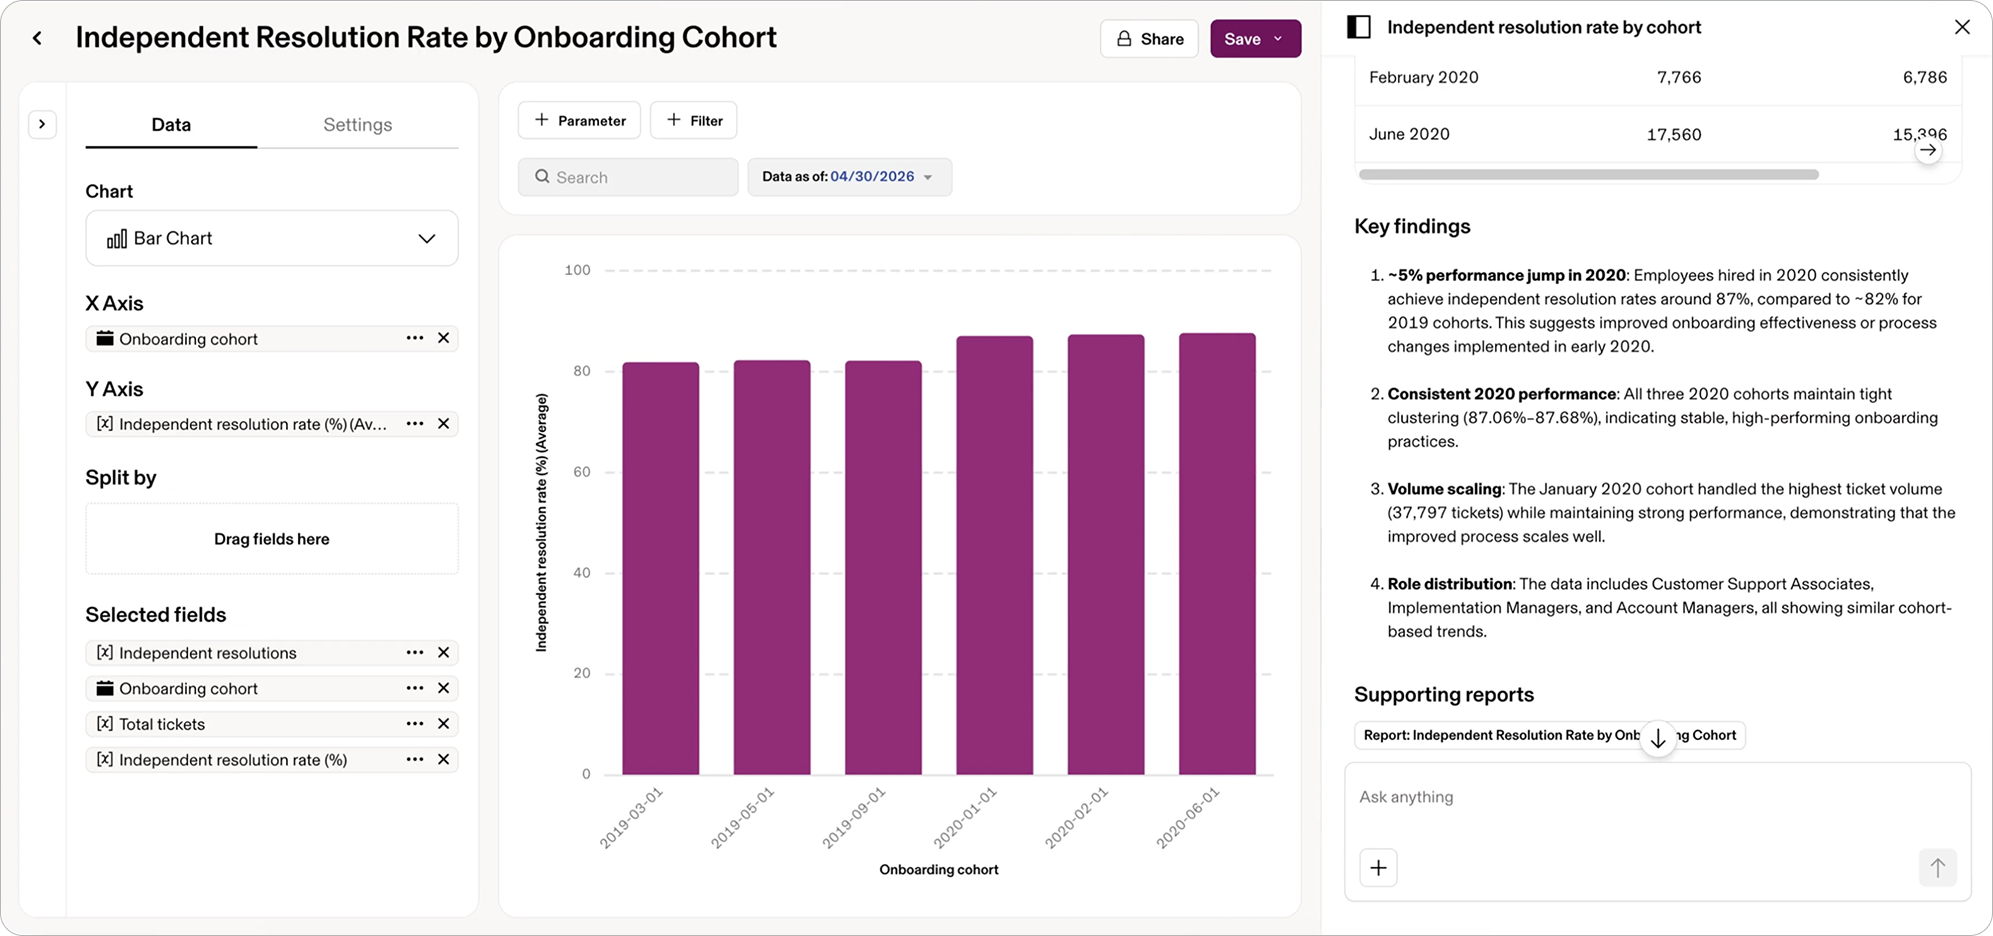
As Product Design Lead for Data Cloud, I led the design of Reports from early strategy through launch. I shaped the core workflows for finding data, building analyses, and sharing results, as well as advanced capabilities including formulas, pivot tables, parameters, conditional formatting, customizable charts, custom SQL, and an AI copilot.
Making enterprise data approachable
Reporting products often force a tradeoff: prebuilt reports are quick but rigid, while full BI tools are powerful but require specialist knowledge. I designed Reports to offer both. People could start with a customizable template or a blank report, find fields in a hierarchical catalog with definitions, and add depth only when the analysis required it.
The same system brought together data across Rippling and third-party apps with role-based permissions, helping operators answer cross-functional questions without exporting data or rebuilding the analysis in a spreadsheet.
From question to shared report
- Discover. Find the right fields and understand their definitions, types, and dependencies.
- Analyze. Use filters, formulas, pivots, parameters, conditional formatting, and charts to turn rows into an answer.
- Share. Save a live report, share it with role-based access, or embed it where decisions happen.
Rippling AI adds another path into the same system: people can ask a question in natural language, receive a generated report, and inspect or refine the fields and logic behind the answer.