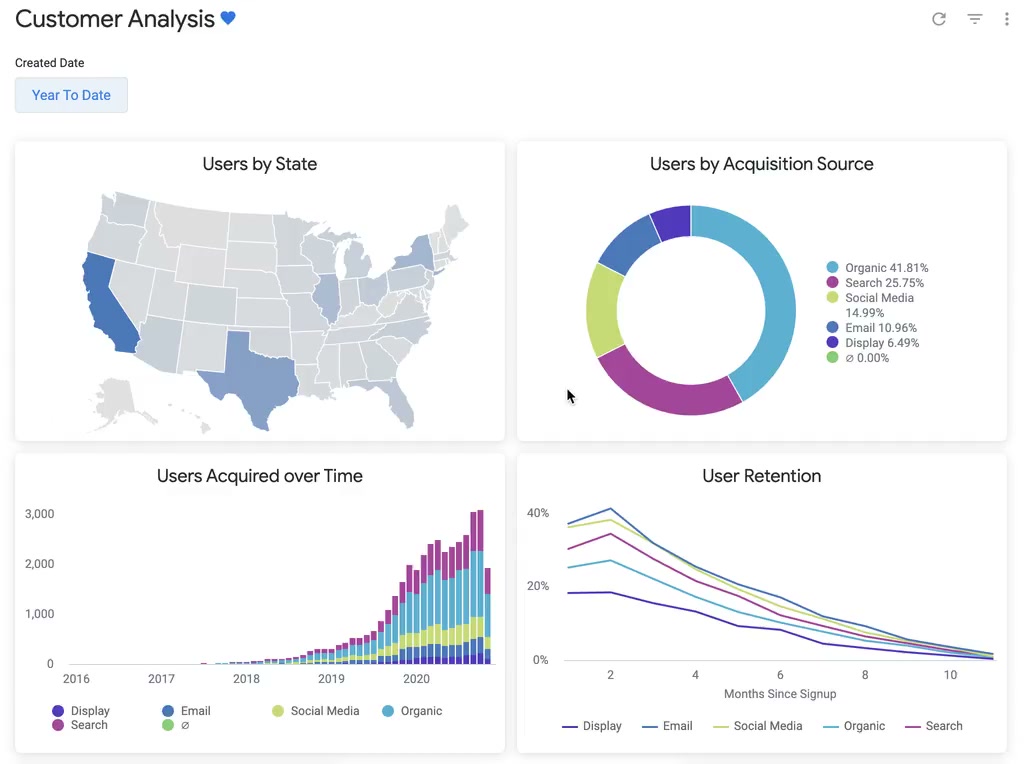
As an Interaction Designer at Google, I helped design the dashboard experience across the viewing surface, edit mode, dashboard filters, cross-filters, alerts, and scheduled reports. My work connected authoring, exploration, and distribution so dashboards could support both active analysis and ongoing monitoring.
Designing for viewers and builders
Dashboards had to work in two modes. Viewers needed to understand the state of the data and interact without changing the shared view for everyone. Builders needed a clear way to add and arrange tiles, configure filters, edit underlying queries, and understand how each change would affect the dashboard. I helped shape the transition between those modes, keeping the viewing experience approachable while giving creators the control to build and maintain complex dashboards.
From shared view to action
- Build. Add queries, Looks, and text, then arrange tiles and connect filters to the right content.
- Explore. Change dashboard filters or select a data point to cross-filter related tiles.
- Monitor. Set an alert on a tile or schedule the dashboard to reach people on a recurring cadence.
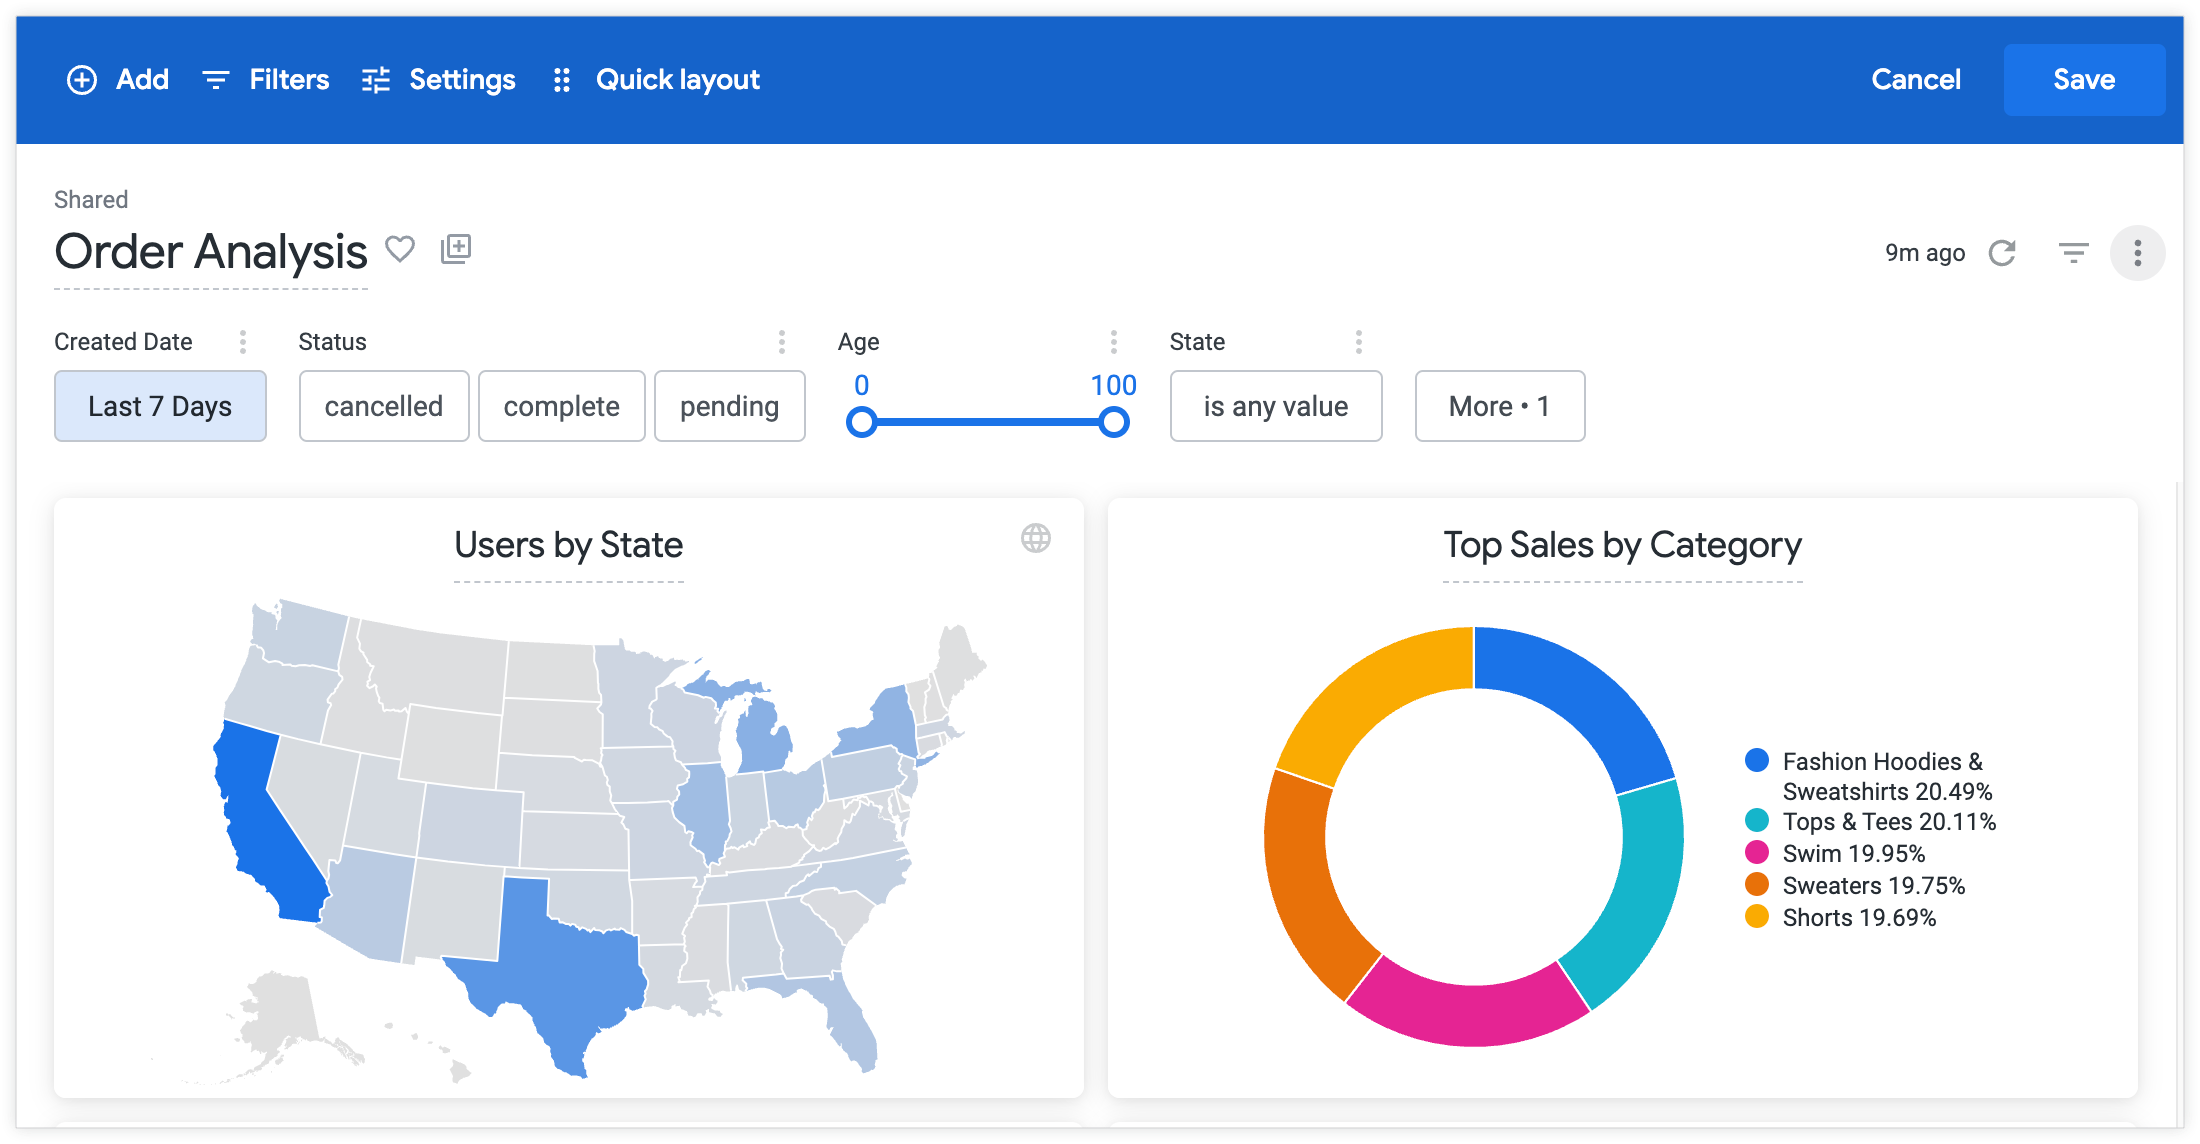
Designing interactions across the dashboard
Dashboard features could not be designed in isolation. A filter might control one tile or the full page, a cross-filter could reshape every related visualization from a single selection, and an alert or scheduled report needed to preserve the intended data context.
I helped develop shared patterns for filter controls, tile states, editing, alert setup, and scheduled delivery. Together, they turned dashboards into interactive tools people could build, explore, and rely on as the underlying data changed.