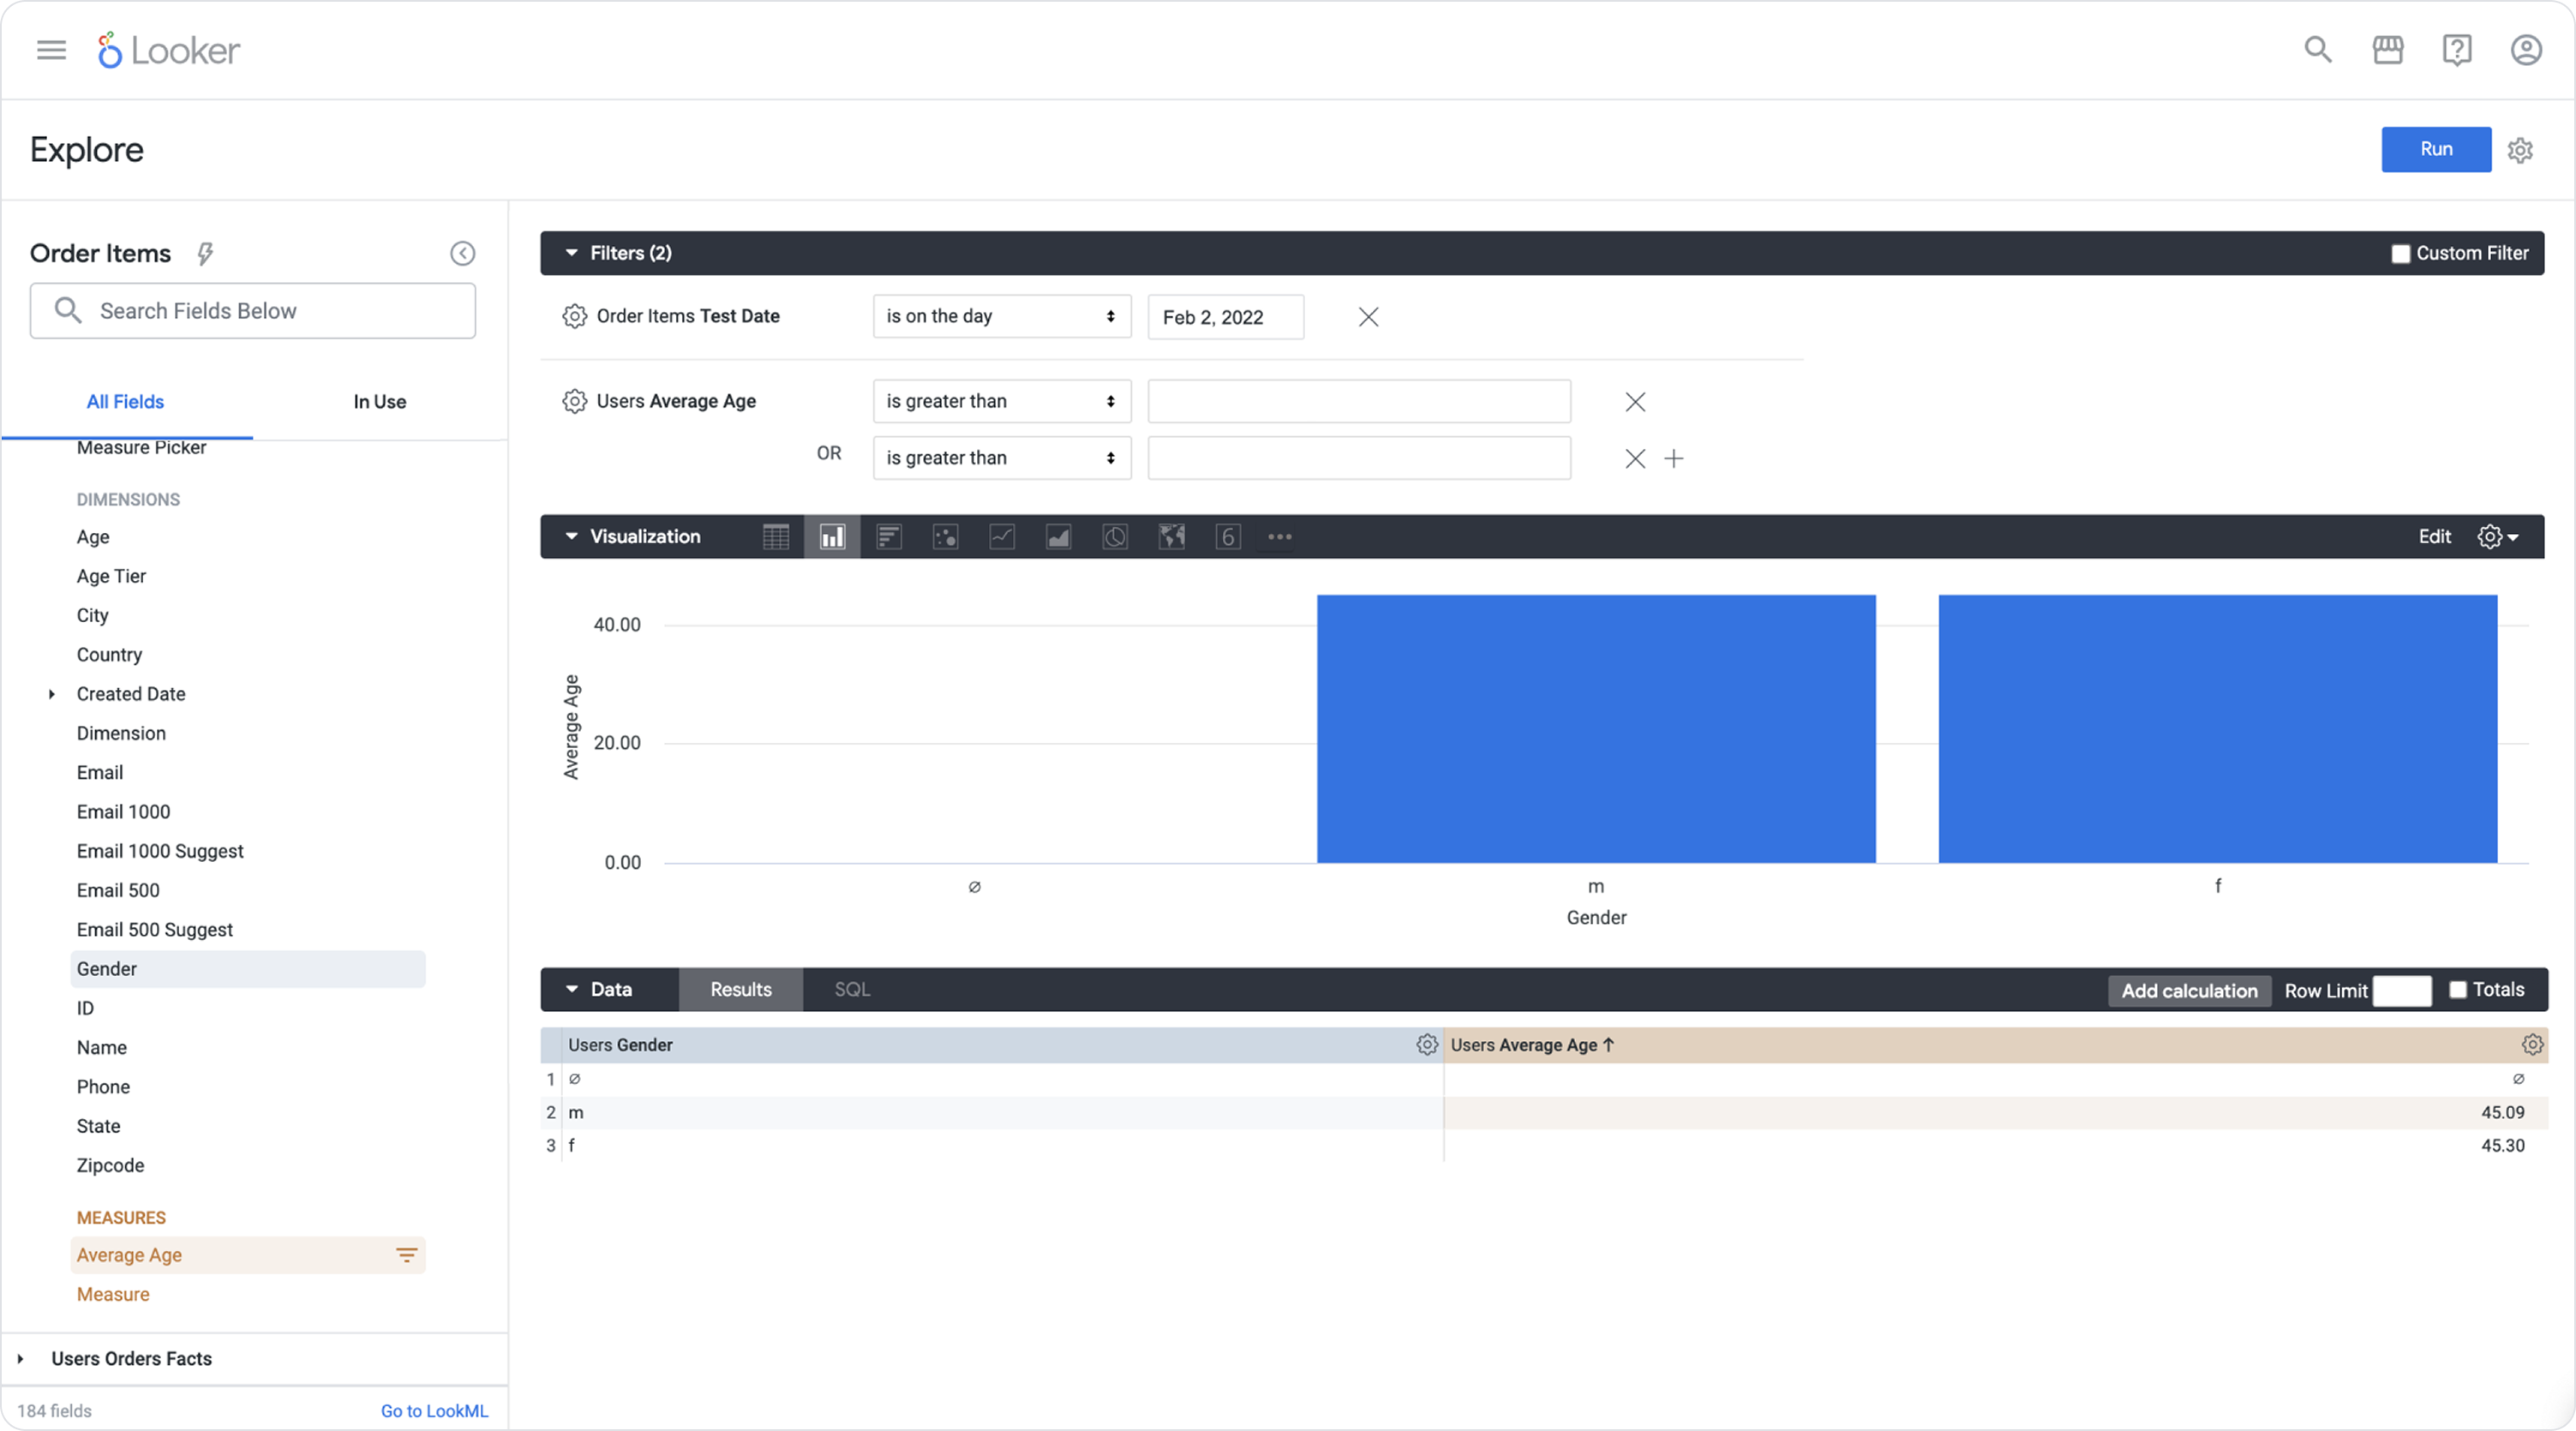
As an Interaction Designer at Google, I contributed to the core Explore experience across the field picker, filters, visualization library, saved Looks, Quick Start analyses, maps and heat maps, and accessibility. My work focused on making a powerful analytical workflow easier to enter, understand, and reuse.
Making exploration easier to start
Explores can have thousands of fields, and oftentimes it can be hard to figure out where to start. I helped design the field picker to make the data model and active query easier to scan, search, and manage. I designed Quick Start analyses as a guided entry point: people could begin with a modeled question, see its fields, filters, results, and visualization together, then adapt it to their own analysis.
From question to saved analysis
- Build. Select dimensions and measures, then apply filters to shape the query.
- Visualize. Choose and configure a chart, including maps and heat maps for geographic patterns.
- Reuse. Save the query and visualization as a Look, add it to a dashboard, or continue exploring from the result.
Charting and Accessibility
I helped evolve the visualization library with common controls for series, axes, colors, labels, legends, and tooltips. I also designed maps and heat maps, which required specialized interactions for geographic data.
I made the Explore experience VPAT accessible, aligning the product with Section 508 and WCAG requirements. Together, the improvements made the path from governed model to answer more approachable without removing the flexibility experienced analysts relied on.